This reporting page has been designed to support the development of Safe Families relationship with local churches.
All reports have been designed to be as flexible as possible by allowing additional filtering and restriction on Region, Local Authority, Dates and a specific member of the CVT.
Filter Options:
Use the green bar across the top to switch between viewing all United Kingdom, with tables split by regions, or viewing a specific region, with tables split by Local Authority.

The grey bar allows you to filter more specifically within the page you are on, as follows.

Local Authority: Use this to select a specific Local Authority. If you are on the UK level, you'll have the option to select any Local Authority. If you are on a specific region, you'll only be able to choose from the Local Authorities within that region. If you select this filter, you will be given averages according to the total number of Local Authorities in a region/the UK.
From: and To: Allows you to choose a specific date range. The default is to show the last 12 months. If you select a date range larger than 12 months, the tables will only display the first 12 months of that range, but the 'Total' columns will refer to the whole date range.
Volunteer Manager: Use this to select a specific CVM. If you are on the UK level, you'll have the option to select any CVM. If you are on a specific region, you'll only be able to choose from the CVMs within that region. If you select this filter, you will be given averages according to the total number of Community Volunteer Managers in a region/the UK.
It is possible to filter by Local Authority and Volunteer Manager together, narrowing your results even further. Along the top of the page you'll see any filters you have set.

Graphs will display different results depending on what level you are viewing. It is possible to switch hidden (greyed out) values on or off by clicking on them. For example:
UK level:

Region level:

Local Authority filter:

Volunteer Manager filter:

Local Authority and Volunteer Manager filters:

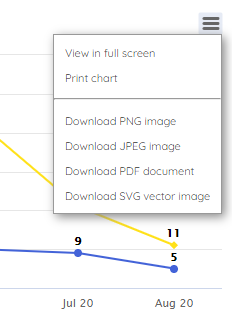
Graphs can be downloaded as an image by clicking on the three lines in the right hand corner of each graph:

Skip to...:
Under the grey bar, you have the option to skip to a specific section of the report.

The available reports have been split into three sections: Church, Volunteer and Family.
Church:
The Church section includes reports around Safe Families direct relationship with local churches.
Church Relationship:
Coming soon... This report will demonstrate the depth of relationship with churches, as judged by the CVT. It will show the progression from Stranger to Family and the indices of church relationship (similar to an Evaluation Outcomes Hexagon as used for families).
Church Engagement:
This set of tables gives a full picture of the amount and type of church engagement activities taking place. Each activity is assigned to the specific CVM who carried it out, and which Local Authority it took place in. The 'Booked' column refers to future events that have been booked. It does not include events in the past that haven't been updated since they were booked (i.e. events with the status 'booked' but with a date that has passed).
Church Engagement by Month: Shows how many church engagement activities in total took place each month, split by region, Local Authority or CVM.
Church Engagement Type by Month: Shows how many of each type of church engagement activity took place each month in or by the region/Local Authority/CVM you are currently viewing.
Church Engagement by Type: Gives the total number of each type of church engagement activity in your chosen date range, split by region, Local Authority or CVM.
Volunteer:
The Volunteer section reports on the areas such as recruitment, approval, matching and activity.
Volunteer Recruitment:
In this section, volunteers are counted against the Local Authority they are in.
The Volunteer Recruitment graph relates directly to table below. Hidden (greyed out) values can be switched on or off by clicking on them.
Volunteer Recruitment by Month: Shows how many volunteers have applied in each month.. Only counts volunteers who are still switched on. Does not include volunteers who applied to be a Resource Friend only.
Volunteer Attrition by Month:
Coming soon... Will show how many volunteers switched off in each month.
Volunteer Growth by Month:
Coming soon... Will show the difference between volunteer recruitment and attrition, to give the total volunteer growth month by month.
Volunteer Approval:
In this section, volunteers are counted against the Local Authority they are in.
Volunteer Average Time to Approve in Days (#): Shows the average number of days it took for a volunteer to go from submitting an application form to being approved as a FF, HF or Connect Friend. Volunteers are listed under the month they first became approved in. The first number in each column is the average number of days, followed by the number of people that relates to in brackets. For example in the row below, in May 2020 five volunteers were approved in Birmingham, and it took an average of 58 days to get them through the approval process. The Region Total and UK Total rows refer to the average number of days for the whole of the region/UK.

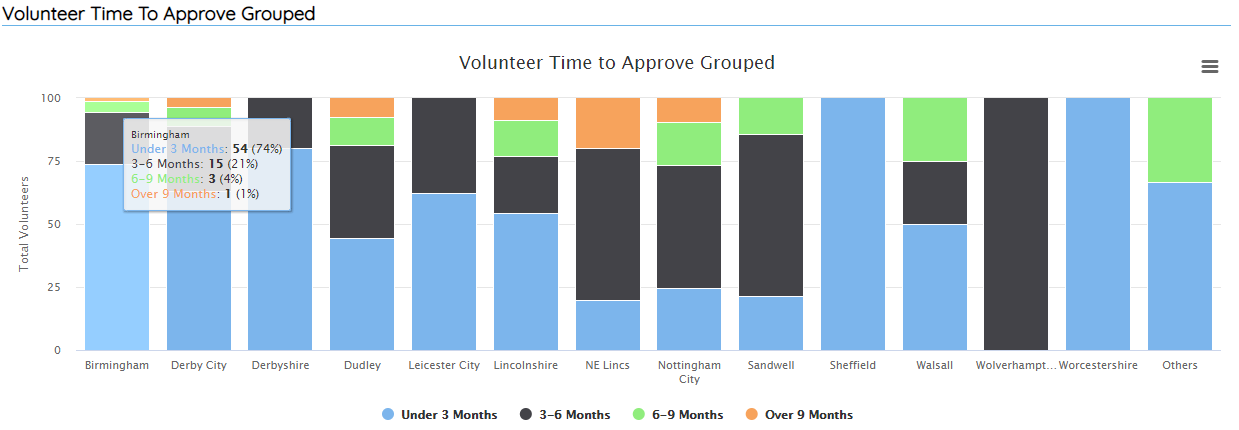
Volunteer Time to Approve Grouped: This section shows the same information as the table above, grouped by how long it took to approve each volunteer. The table shows the total number of volunteers approved in the date range selected (defaults to the last 12 months). The first number in each column is the number of volunteers approved in that time frame, followed by that number as a percentage of the total number of volunteers approved in the selected date range. For example in the row below, 54 volunteers in Birmingham took Under 3 Months to approve, which is 74% of the total number of Birmingham volunteers approved in the last 12 months.

The Volunteer Time to Approve Grouped graph relates directly to the table below it, displaying the percentage of volunteers coming under each time period. Hover over each bar to see the number of volunteers and exact percentages that it relates to, as in the example below.

Volunteer Matching:
In this section, volunteers are counted against the Local Authority they are in.
Volunteer Average Time to Match in Days (#): Shows the average number of days it took for a volunteer to go from being approved as a FF, HF or Connect Friend to being matched with their first family. Volunteers are listed under the month they are first matched in. The first number in each column is the average number of days, followed by the number of people that relates to in brackets. For example in the row below, in June 2020 nine volunteers were matched for the first time in Birmingham, and it took an average of 19 days from them being approved to being matched with their first family. The Region Total and UK Total rows refer to the average number of days for the whole of the region/UK.

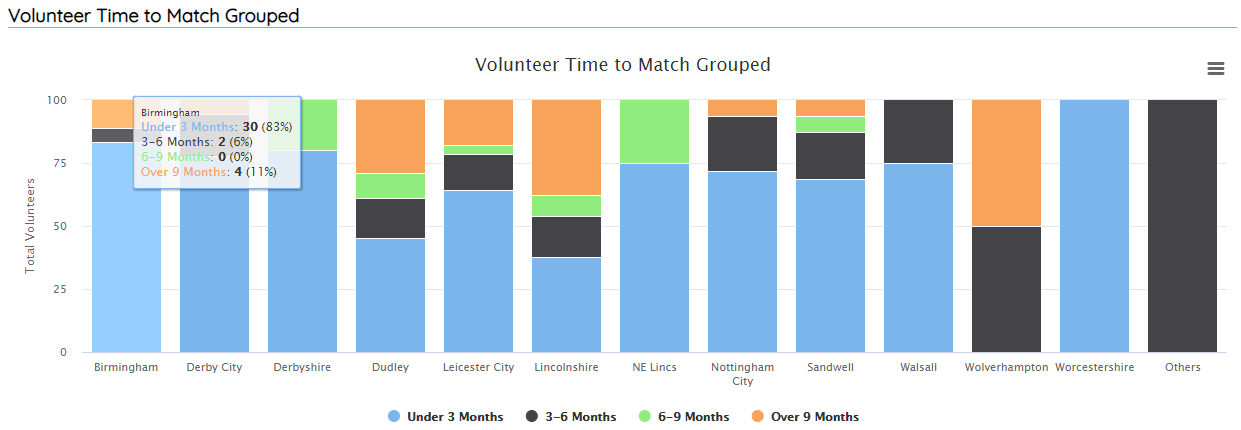
Volunteer Time to Match Grouped: This section shows the same information as the table above, grouped by how long it took to first match each volunteer. The table shows the total number of volunteers matched to a family for the first time in the date range selected (defaults to the last 12 months). The first number in each column is the number of volunteers matched for the first time in that time frame, followed by this number as a percentage of the total number of volunteers matched for the first time in the selected date range. For example in the row below, 30 volunteers in Birmingham took Under 3 Months to go from being approved to matched with their first family, which is 83% of the total number of Birmingham volunteers first matched in the last 12 months.

The Volunteer Time to Match Grouped graph relates directly to the table below it, displaying the percentage of volunteers coming under each time period. Hover over each bar to see the number of volunteers and exact percentages that it relates to, as in the example below.

Volunteer Activity:
In this section, volunteers are counted against the Local Authority of the family they supported.
A volunteer is considered as active within a month if they have been assigned to a family at any point within that month. For example, if the support for an assignment ran from 17/09 to 03/11, the volunteer would count as active in September, October and November.
Percentage of Volunteers Active: This graph shows the percentage of the total number of approved and switched on volunteers for the region/Local Authority you are viewing, who were active in each month.
Active Volunteers by Month: Gives the total number of volunteers in each region/Local Authority who were active in each month.
Volunteer Statuses: Shows the total number of volunteers who have submitted an application form within the chosen date range (defaults to the last 12 months), and where they got to from the beginning of the approval process to supporting their first family.
The 'Switched Off' section shows volunteers who have applied within the chosen date range and since switched off, split by how far along the approval process they reached. Those up to and including 'Approved' never supported a family before switching off, while those under 'Supported' have supported one or more families but are now switched off.
The 'Current Volunteers' section shows volunteers who are still switched on. Either they are somewhere along the approval process ('In Training'), have been approved but not yet supported a family ('Waiting') or are 'RF Only' meaning they may or may not have given support as a Resource Friend, but have not given support as an FF, HF or Connect Friend and do not currently have those roles.
This table gives the number of volunteers in each category, followed by this number as a percentage of the Total Applications received in the given date range. For example in the row below, 4 volunteers in Central had references sent in but have since switched off without supporting a family, which is 1% of the 344 volunteer applications received in Central over the last 12 months.

Family:
The Family sections highlights the need for support and the positive outcomes the volunteers' support has had on families.
Families Waiting:
Families Open-Unassigned: Shows the number of referrals received that hadn't yet been assigned to a volunteer on the last day of each month. Requests to support these families had not necessarily been posted out within that month, meaning the number given is not the number of families ready and waiting to be linked to a volunteer, but rather the total number of referrals not yet being supported by a volunteer, anywhere along the process.
Evaluation Outcomes:
This section brings in an average of the family evaluation outcomes scores for the region/area you are looking at over the chosen date range (defaults to last 12 months), to demonstrate the difference being made by the volunteers in your area.
If you are on the UK level, the scores in this section will relate to the whole of the UK. If you are on a regional level, the scores will relate to an average for that region. If you have filtered by a specific Local Authority, the scores will be an average for that Local Authority, while if you have filtered by a specific CVM the scores will be an average for all the areas they are responsible for.
Outcome Hexagon: Displays an average of the total family evaluation outcomes scores for the region/area you are viewing.
Evaluation Outcome Scores: Gives a breakdown of the average family evaluation outcomes scores for the region/area you are viewing.
Families Supported:
Families Having Community Widened: Shows the number of families each month who have had their community widened by being connected with a volunteer(s). These numbers are based on the date support started.
Families Connected to a Community: Shows the number of families each month who have been connected in to their local community through Safe Families, because they are staying in touch with their volunteer or with a community group they were introduced to, after support has closed. Numbers are based on the date support closed. This information is gathered via closure surveys and was only recently added as a question, so numbers will show as 0 before May 2020.